DOE for Process Cheese

Recently, Land OLakes researchers set out to improve a new deli process cheese formulation, without impacting its other attributes.
Senior scientist Mostafa Galal, Ph.D., and senior technologist Michael Scheller, who used Stat-Eases Design-Expert® experiments (DOE) software, created a general factorial design using two factors: emulsifier ratio (four levels) and emulsifier type (two). The goal was to find out which ratio and type of emulsifier salt (referred to hereafter as emulsifier) would result in the desired improvement in appearance without affecting the other responses.
Cheese sauce makeover
We are continually examining the recipes of our current products in order to find ways to exceed our customers expectations, Scheller said. Recently, Mostafa Galal developed a new process-cheese formulation that seemed promising but exhibited some Maillard browning when the product was melted in finished product applications. The browning had no effect on the taste or safety of this product; however, most consumers prefer to have cheese maintain its white color when melted in queso sauce. Maillard browning is caused by a chemical reaction between an amino acid and a reducing sugar, usually requiring heat.
This problem was not easy to solve because the formula contains many different ingredients and multiple processing steps, Scheller says. The effects of these ingredients and the processing steps could interact with each other, which makes it difficult to get a grip on the problem using conventional one-factor-at-a-time (OFAT) experiments. We began using DOE because it lets us look simultaneously at the effects of all the factors. It also provides statistical analysis that helps separate the single factor and multiple factor effects and allows us to optimize the values of each factor.
Designing the experiment
Two different emulsifiers are used in the product. Their total amount is fixed, but the relative amount of each emulsifier can vary. Scheller decided to use the ratio of the two as a single factor instead of treating each emulsifier separately. This reduced the number of factors required from three to two, which in turn substantially reduced the number of runs for the experiment. The factors are:
A) Emulsifier type (Type 1 or Type 2). Emulsifier type refers to the emulsifier source and delivery system, which are not explicitly stated for reasons of confidentiality.
B) Ratio between different emulsifiers used in product (A, B, C or D)
The goal was to reduce the browning without having any negative effects on either flavor or meltability. Browning can be measured using the Hunter Lab Colorimeter. Using the Hunter, the color space variable a is the parameter most useful for monitoring browning in queso sauce. Positive a is red, and negative a is green. One of the objectives in this experiment is reducing the Hunter a level, which corresponds to less browning.
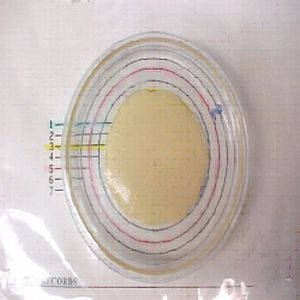
At the same time, the meltability of the cheese needs to be maintained at least at the level of the current product. Meltability is measured by cutting a disk of cheese of a specified size, and placing the disk in a glass Petri dish. A technician heats the Petri dish in an oven at 350oF for seven minutes, then pulls the dish out and measures the diameter of the circle the melted cheese has formed.

Photo 1: Meltability is measured by the diameter of the circle the melted cheese has formed
This experiment used the pH of the cheese as a benchmark to monitor potential changes to the flavor. The pH needs to be high enough to avoid creating an acidic taste, but not too high because that would affect shelf life. The responses for the experiment were thus:
1) Browning (Hunter a value)
2) Meltability
3) pH
Standard Order | Run (Random) | Factor A | Factor B |
1 | 11 | A | Type 1 |
2 | 2 | A | Type 1 |
3 | 3 | B | Type 1 |
4 | 10 | B | Type 1 |
5 | 4 | C | Type 1 |
6 | 16 | C | Type 1 |
7 | 1 | D | Type 1 |
8 | 5 | D | Type 1 |
9 | 8 | A | Type 2 |
10 | 13 | A | Type 2 |
11 | 15 | B | Type 2 |
12 | 6 | B | Type 2 |
13 | 12 | C | Type 2 |
14 | 14 | C | Type 2 |
15 | 9 | D | Type 2 |
16 | 7 | D | Type 2 |
Figure 1: Designed experiment
Scheller input the factors into the DOE software and generated a 16-run experiment in which each of the eight design points were replicated as shown in Figure 1. The order is randomized to reduce bias from lurking time-related variables such as change in ambient temperature, or humidity and the like. The results were then entered into the software and analyzed.

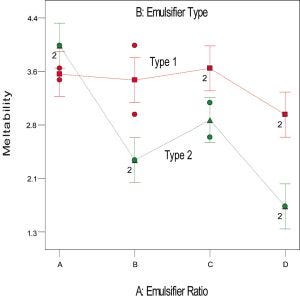
Figure 2: Meltability model graph
First, the meltability response was considered. A meltability score within the range of 3 to 6 was desired for this trial product. Figure 2 shows a graph of the model for meltability. The model has an F-value of 14.99, which indicates there is only a 0.05% chance (p = 0.0005) these results could be caused by noise. The graph shows that, for this experiment, when the Emulsifier Type 1 is used, meltability is consistently within specification, Scheller says. On the other hand, when Emulsifier Type 2 is used, meltability is all over the map. The bars indicate the least significant difference (LSD) for 95% confidence. These show a clear separation in meltability by Type, see emulsifier ratio D, for example.

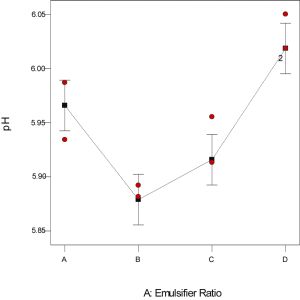
Figure 3: pH model graph for Type 1 emulsifier
Next, the model for the pH response was analyzed. It generated an F-value of 16.02 (p = 0.0002). Scheller eliminated the Emulsifier Type 2 runs from this analysis since the meltability model already indicated that this emulsifier produced unacceptable results. To eliminate acidic flavor notes, the ideal pH for this formulation needed to be between approximately 6.00 and 6.15. The model in Figure 3 shows that an emulsifier ratio of D provides good pH results.

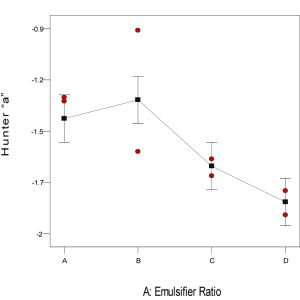
Figure 4: Hunter a model graph for Emulsifier Type 1
Identifying a workable solution
Finally, the effect of emulsifier ratio on the browning of the cheese was analyzed as indicated by the Hunter a value. The model produced an F-value of 9.04 (p = 0.0021). The results indicate that an emulsifier ratio of D provides a Hunter a value of about -1.83, which is a significant improvement over the baseline formulation for this product. DOE helped us show that it is possible to improve the appearance of the new product in cheese sauce application without adversely affecting other characteristics, Scheller says.
This was the first time that Mostafa and I applied DOE on the project, Scheller concludes. The application demonstrated the ability of DOE to provide a degree of rigor that imparts more confidence in the results than our previous one-factor-at-a-time experimentation. DOE explores the entire design space, which helps eliminate concerns that a better answer might be lurking somewhere in the unknown. For certain applications, DOE can reduce the number of runs required to achieve meaningful results, providing substantial savings in time and materials.
Jerry Fireman, president, Structured Information, Lexington, MA, has over 30 years experience in writing technical articles, with over 9,000 articles published to date.
Land OLakes is a farmer-owned cooperative that offers farmers, local cooperatives and customers across the nation an extensive line of agricultural supplies, as well as production and business services. It is also a leading marketer of dairy-based products for consumers, foodservice professionals and food manufacturers. Land OLakes produces a full line of quality dairy products, including: butter and butter blends, margarine and spreads, dairy case cheese, and deli cheese. For more information, email Michael Scheller at [email protected], or log on to www.landolakesinc.com, www.landolakes.com or www.statease.com.
About the Author
You May Also Like